Application Telemetry & Observability
Struktural provides deep visibility into both application performance and business activity. It achieves this through a dual-layered approach: OpenTelemetry (OTel) for infrastructure-level metrics and distributed tracing, and the Internal Activity Log for business-level audit trails.
1. Configuring Telemetry Providers
Logging and telemetry are configured per tenant (or globally) within the app-config.json file under the Logging node.
The platform supports natively shipping OpenTelemetry traces, metrics, and logs to external sinks without requiring third-party agents.
Application Insights (Azure Monitor)
When configured, Struktural automatically exports telemetry to Azure using the official Azure Monitor OTel Exporter.
"Logging": {
  "Provider": "ApplicationInsights",
  "ConnectionString": "InstrumentationKey=your-key;IngestionEndpoint=...",
  "MinimumLevel": "Information"
}
(Note: You can also omit the ConnectionString from JSON and rely on the standard APPLICATIONINSIGHTS_CONNECTION_STRING environment variable).
AWS CloudWatch
Exports standard application logs directly to an AWS CloudWatch Log Group.
"Logging": {
  "Provider": "CloudWatch",
  "CloudWatchLogGroup": "struktural-prod-logs",
  "CloudWatchRegion": "us-east-1",
  "MinimumLevel": "Warning"
}
Console (Default)
Standard stdout logging, ideal for local development or when using sidecar container log shippers (like Fluent Bit or Promtail in Kubernetes).
"Logging": {
  "Provider": "Console",
  "MinimumLevel": "Information"
}
2. Distributed Tracing & Custom Metrics
Struktural automatically injects and propagates a TransactionId (X-Transaction-ID HTTP header) across the entire pipeline. This ID connects frontend user clicks, backend API executions, database queries, and external Web Service invocations into a single distributed trace.
The engine emits several custom OpenTelemetry Metrics (under the Struktural.Engine meter) that you can visualize in your APM dashboards (Grafana, AppInsights, Datadog):
struktural.operation.duration(Histogram): Execution time of standard CRUD operations, tagged byAppId,Entity, andOperation(Create, Read, Update, Delete).struktural.query.result_size(Histogram): Number of records returned by grid queries and lookup fields.struktural.script.duration(Histogram): Execution time of dynamically compiled C# scripts (e.g.,OnValidate,BeforeCreate).struktural.action.count(Counter): Tracks the invocation of Custom Actions (UI Buttons).struktural.external_api.duration(Histogram): Measures latency when calling integrated OpenAPI services via theIExternalServiceInvoker.struktural.ui.action.duration(Histogram): Measures the full round-trip latency of a user clicking a button in the Vue.js frontend until the backend responds.struktural.client.navigation.duration(Histogram): Client-side rendering times for moving between views.
3. The Internal Activity Log (Struktural_Sys_ActivityLog)
While OpenTelemetry handles performance and infrastructure, the Struktural_Sys_ActivityLog table handles business observability. It stores human-readable events directly in the tenant's relational database.
This log captures:
- Script Logs: When a developer calls
Log("Message")from a C# script, it is written here, tied to the specific user and transaction. - Workflow Execution: Traces when background workflows start, fail, or hit specific nodes (like
SendEmail). - Read Audits: If an entity contains highly sensitive fields (
ApplicationWideSecureString), the platform automatically logs a "Read" event in this table whenever those records are queried, ensuring strict GDPR/HIPAA compliance for unauthorized data access. - System Errors: Fatal unhandled exceptions that slip past validation scripts are intercepted and logged here before returning a safe
500 Internal Server Errorto the user.
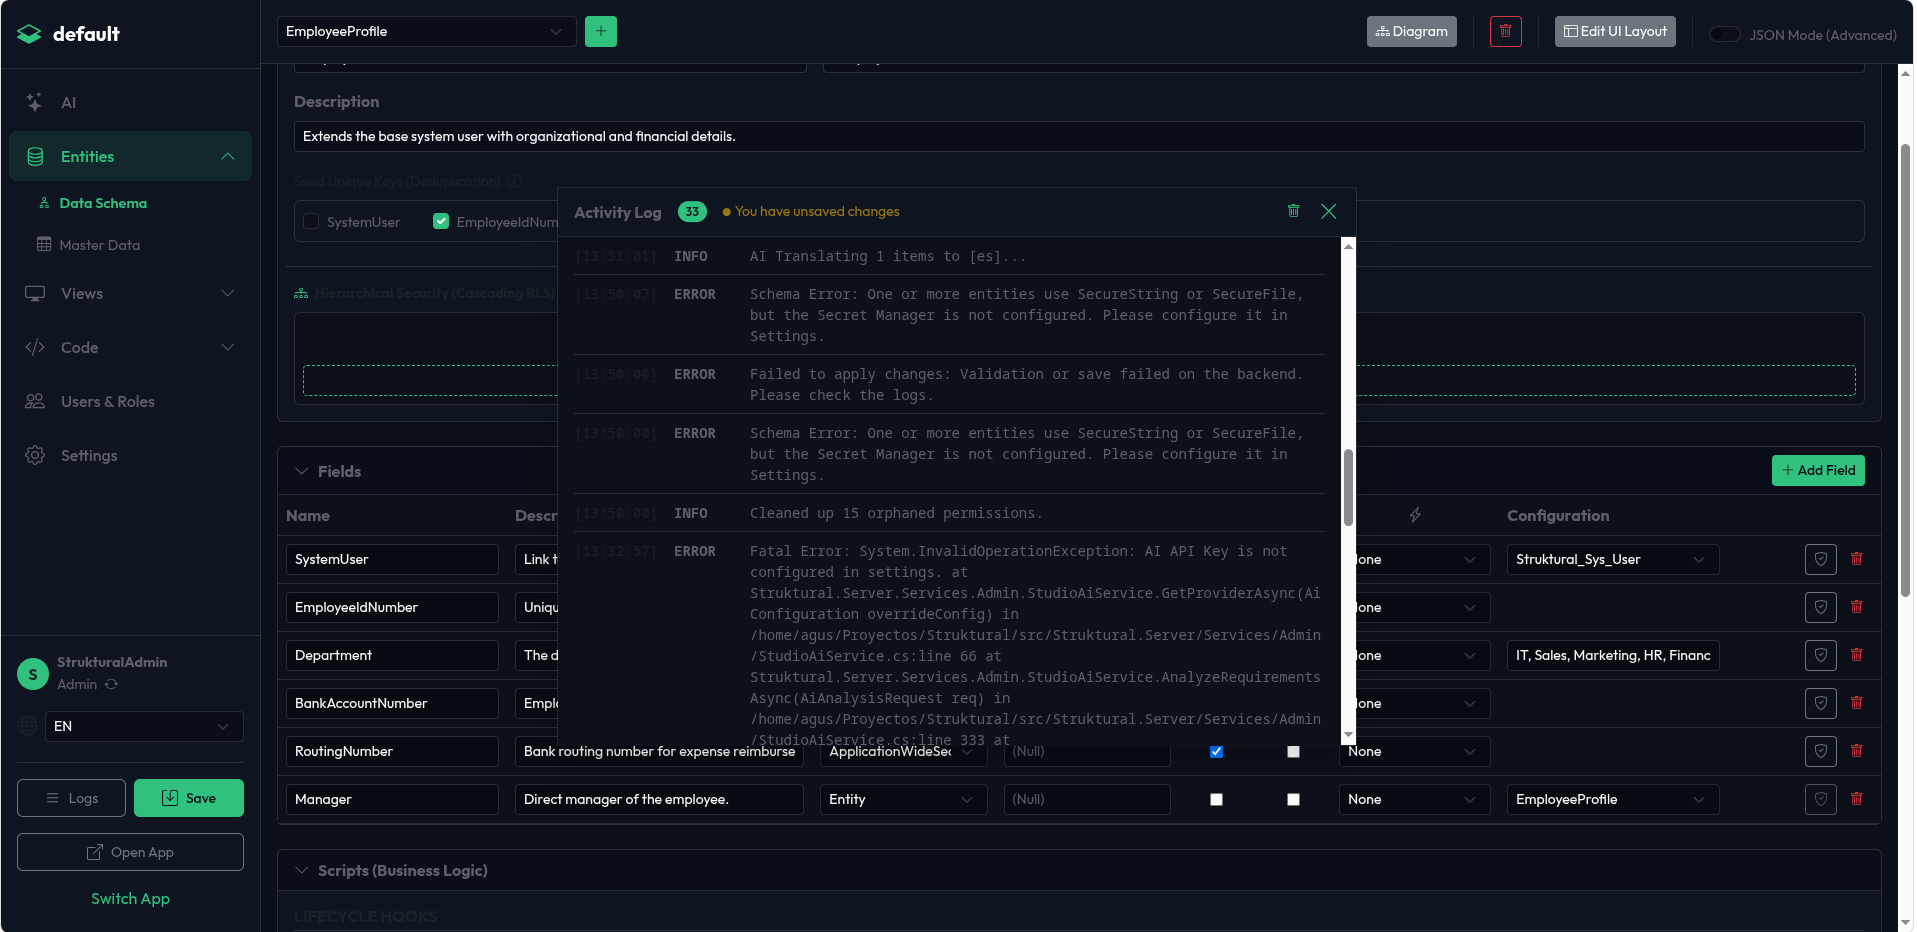
Viewing Logs (UI Approach): Because this table is highly active, administrators can view the logs directly inside the Studio without running database queries.
- At the bottom of the left sidebar, click the Logs (List icon) button.
- This opens the Activity Log Overlay, displaying real-time events, System Errors, and Master Data (Seed) validation errors.
- If there are unsaved changes in your workspace, a pulsing orange warning will appear here. If Master Data fails referential integrity checks during generation, a red notification badge will appear over the Logs button.
4. Frontend Telemetry
The platform's frontend automatically collects anonymous UX performance metrics. Every time a user navigates between views or triggers a custom action, the client measures the rendering duration and posts it asynchronously to the /api/telemetry/* endpoints.
This ensures that network latency and browser rendering times are factored into your APM dashboards alongside backend database execution times.